Technical analysis is a method of predicting the price of a financial instrument based on mathematic (not
economic) calculations. Another words, unlike in fundamental analysis, economic factors are not taken into the
account in technical analysis. At first glance it may look absurd to try and predict the prices without taking into
account interest rates, unemployment data, GDP levels, trade balances and so on. But those traders who rely on
technical analysis only when buying or selling think that the price itself reflects the economy. They analyse the
price movements in the past using various methods and predict what would be the price in the future. The results of
such prognosis are usually correct. There are a vast number of theories and methods to analyse them. We use here
one example only to illustrate that.
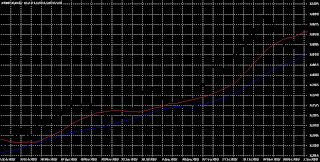
Let’s look at the intraday chart of EURUSD for 2007.
There are two lines on the chart that indicate sliding medium prices of the pair: blue – 100 days and red – 50 days
period. The strategy would be to buy when the price is approaching the red line from below (blue arrows on the
chart) and to sell when the price returns to red line from above. As you can see, this very simple indicator may help
to make a profit on the rising trend. Of course the same indicator is used on the down trend also when the red line
is below the blue one.
Many traders end up loosing money because they simply do not learn how to use technical analysis indicators. It is
not enough just to call up a chart on your screen, it is important to know how to read it. There are plenty of
indicators available in your MT4 terminal. If you still do not have one, you can download a free demo here.
It is important to know that you do not need to learn all the indicators. It is recommended to choose a few and to
learn them inside and out. Once you have a deep understanding of an indicator you should be able to anticipate
what it will look like when you apply it to the chart. You would be surprised if you new that some major traders
use a very simply and straight forward techniques for their analysis.
These are the most commonly used indicators:
Moving averages
Parabolic SAR
Directional movement index (DMI)Relative strength index (RSI)
Slow stochastics
MACD
Another extremely important tool is Bollinger Bands. It is used to detect periods of low volatility in the market,
reflected by drawing together bands. Low periods are usually followed by sharp breakouts and sudden increase in
volatility, which is an excellent opportunity of the trader to enter the market that offers potential significant profits
with well defined risks. It is also recommended to have at least a basic understanding of Elliot Wave.
The applications of the technical analysis in the forex market would be to determine the overall currency trend as
well as for short term timing of trades.
It is a good idea to set up your screen layouts in such a way that you see intraday charts of 4-6 major pairs at the
same time. This is possible to do in your MT4 trading terminal. For intraday trading you may want to use 30
minute charts although other periods are also available. You will notice that sometimes currency pairs move in
unison and may be tempted to trade a few pairs at the same time. If you are a beginning trader you should avoid
doing that and try to trade one pair at a time.
Stick to tried and trusted simple techniques available on the market. Do not try to invent the bicycle. It will save
you time and money and will help you to trade successfully.

No comments:
Post a Comment